

Photo: Predrag Trokicic
Ever since social inequalities in Serbia started rising rapidly, due to restoration of capitalism, we didn’t have a chance to see them in plain numbers – for decades, statistical data about economic welfare has been served to us through the mediums of GDP and “average salary”, which really tell us nothing about the way in which “domestic product” or salaries are distributed within society.
Abuse of statistics has lately reached the level of mental acrobatics – the best example so far is the use of different methodologies to calculate (un)employment and average salary. Namely, according to the Labour Force Survey conducted by the Statistical Office of the Republic of Serbia (SORS), if you are an unpaid family worker or work one hour per week and get paid in money or goods, have a service contract or contract on temporary or occasional employment, you are not unemployed, even though you aren’t able to claim the rights of an employed person in accordance with the Labour law. However, when it comes to calculating the “average salary”, you are no longer employed, since that category only includes those holding an employment contract, which rules out exactly the persons with the lowest incomes, those who are not guaranteed even the minimum wage. Concerns about the credibility of data on average salary have already been expressed, addressing the issue of over-representation of companies with above-average salaries in the sample.1
If, for a moment, we ignore the sample based on which it is calculated, what else is wrong with the “average salary”, which political elite always presents as the most relevant indicator of economic progress? It is calculated as an arithmetic mean of all salaries – the sum of all salaries is divided by the number of people earning them. In societies with pronounced inequality, the extremely high salaries of a few can greatly distort the picture.2 According to Eurostat data, Serbia is the country with the most extreme inequalities in Europe.
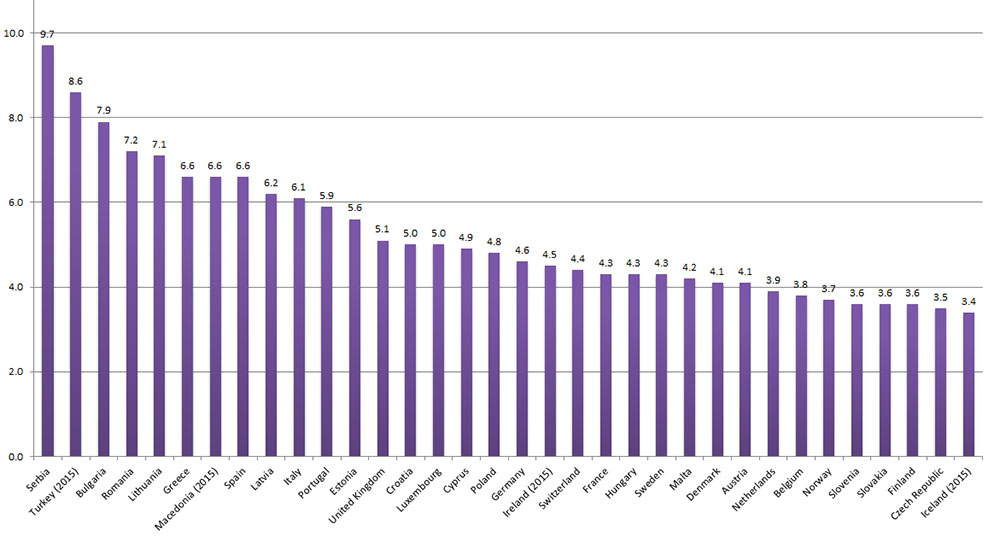
Graph 1. Inequality in Europe – income ratio of the 5th and the 1st quintile in 2016. Source: Eurostat. For 4 countries for which the data from 2016 weren’t available, data from 2015 are displayed.
In this case, inequalities are calculated by comparing the income of the highest earning 20% of the population (so-called fifth quintile) with the income of the lowest earning 20% of the population (first quintile). As presented in the graph, with income of the fifth quintile being 9.7 times higher than the income of the first quintile, inequalities in Serbia are almost three times higher than those in Slovenia, the Czech Republic, or Slovakia, countries with which we shared a more egalitarian economic system until only a quarter of a century ago. In Serbia today, inequalities are even greater than in the USA, where this quintile ratio is 8.3.3 The USA is considered a country of deep and, for European standards, unusually widely accepted4 inequalities, with large numbers of homeless people and tens of millions of people with no health insurance.
In statistics, there are also so-called positional averages – the mode and the median – which depict the reality far better than arithmetic average in societies with profound economic inequalities. The mode or modal income would be the most frequent income. The median income would be the income of a person in the very middle of an arranged series – half the population has a higher income and the other half has a lower income than that person. Our Statistical Office doesn’t publish the data on median salary. When Danas reporter asked the SORS about this, they replied that the current method of gathering data “doesn’t provide data on the individual salary of each employee necessary to calculate the median”.
However, as part of the EU accession process, Serbia has accepted the obligation regarding methodologically uniform monitoring of statistical indicators in all member states and candidate countries, as well as regular implementation of a survey on “income and living conditions”. Therefore we can now find data on the distribution of total income in Serbia for the past four years on the Eurostat website. And it immediately becomes clear why no one is in a hurry to inform the general public about these findings.
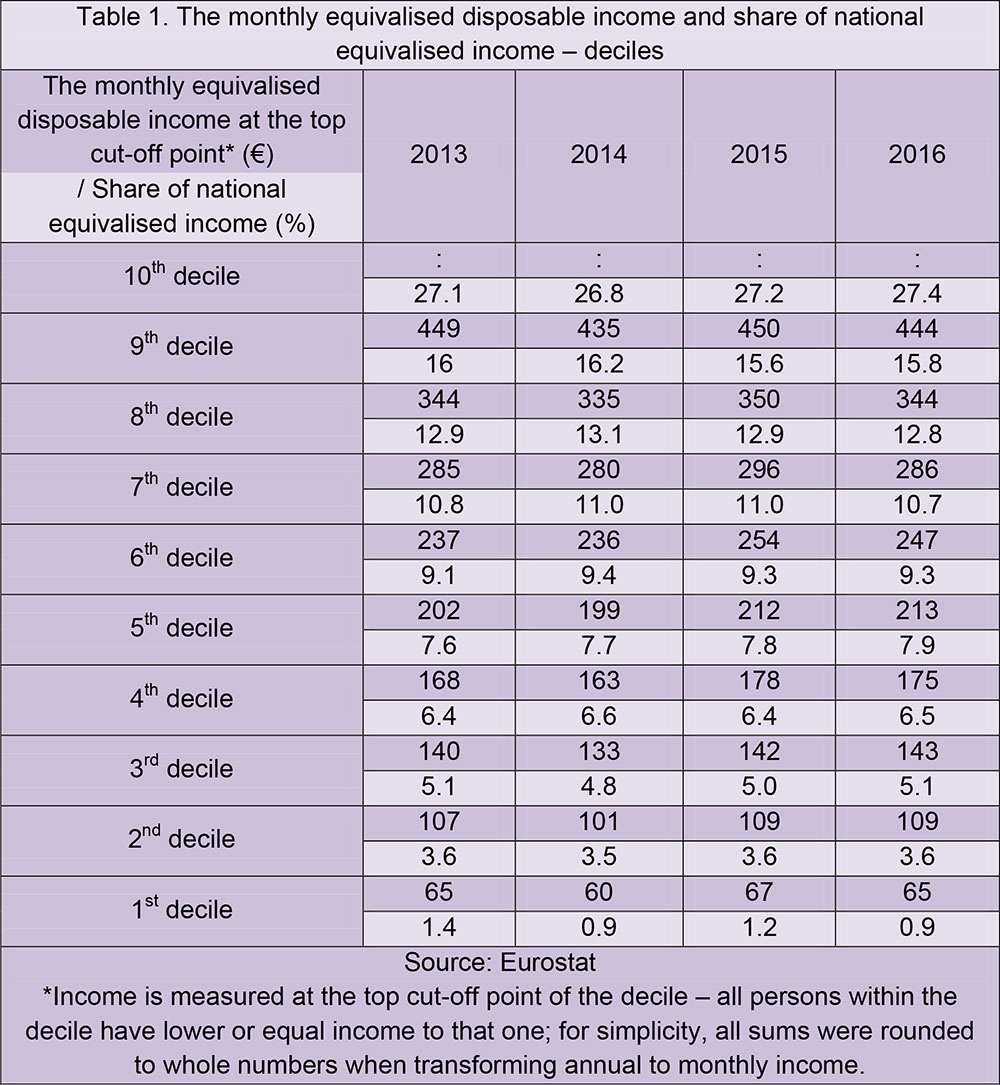
In 2016, half the population of Serbia5 had a (total disposable) income of less than €213, and three quarters6 had an income of less than €312. 80 percent of the population had an income lower than €344, i.e. an income €30 lower than the “average salary” in 2016. The ninth income decile7 is the first one to reach the arithmetic average of salaries and the total of €444 at its top point. So, only about 15 percent of the population has an income equal to or higher than the official “average salary”, and only 10 percent have an income higher than €444.
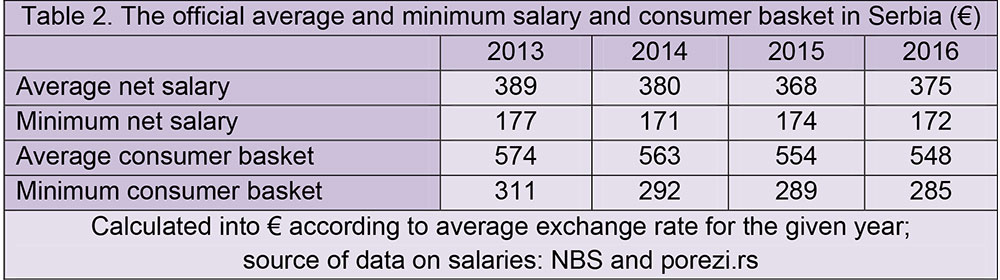
If we compare monthly income with official salaries in Serbia, we see that about 40 percent of the population has income lower than the minimum wage and that the income of the next 40 percent is lower than the average salary. 70 percent of the population has income lower than the official minimum consumer basket, while less than 10 percent of the population with the highest income can afford an average consumer basket. Here we should also stress the deeply disturbing character of having two different “consumer baskets” which demonstrates the attitude of the state towards the poor as second-class citizens with different, lesser needs than the rest of society.
In order to discuss the really high incomes in Serbia, we would need the data on the income of a permille, the thousandth portion of the population, which, unfortunately, is not available from any of the sources, including Eurostat.
The incomes of the famous top “one percent” (so-called hundredth percentile) start at €914, which, even though unimaginably high for the majority of the citizens of Serbia, isn’t really that much.8 This level of income is, actually, the sum needed for the dignified life of any citizen of Serbia, in order to be able to afford what was considered ordinary thirty years ago in SFRY, or at least in its urban areas – not to worry about paying the bills and buying food, being able to afford a holiday, medical care, education for their children, to replace a broken refrigerator (or now – a computer) without having to rely on a loan which would dramatically tighten their budget for years. Dignified life is currently a privilege enjoyed by 1-3 percent of the total population of Serbia.9
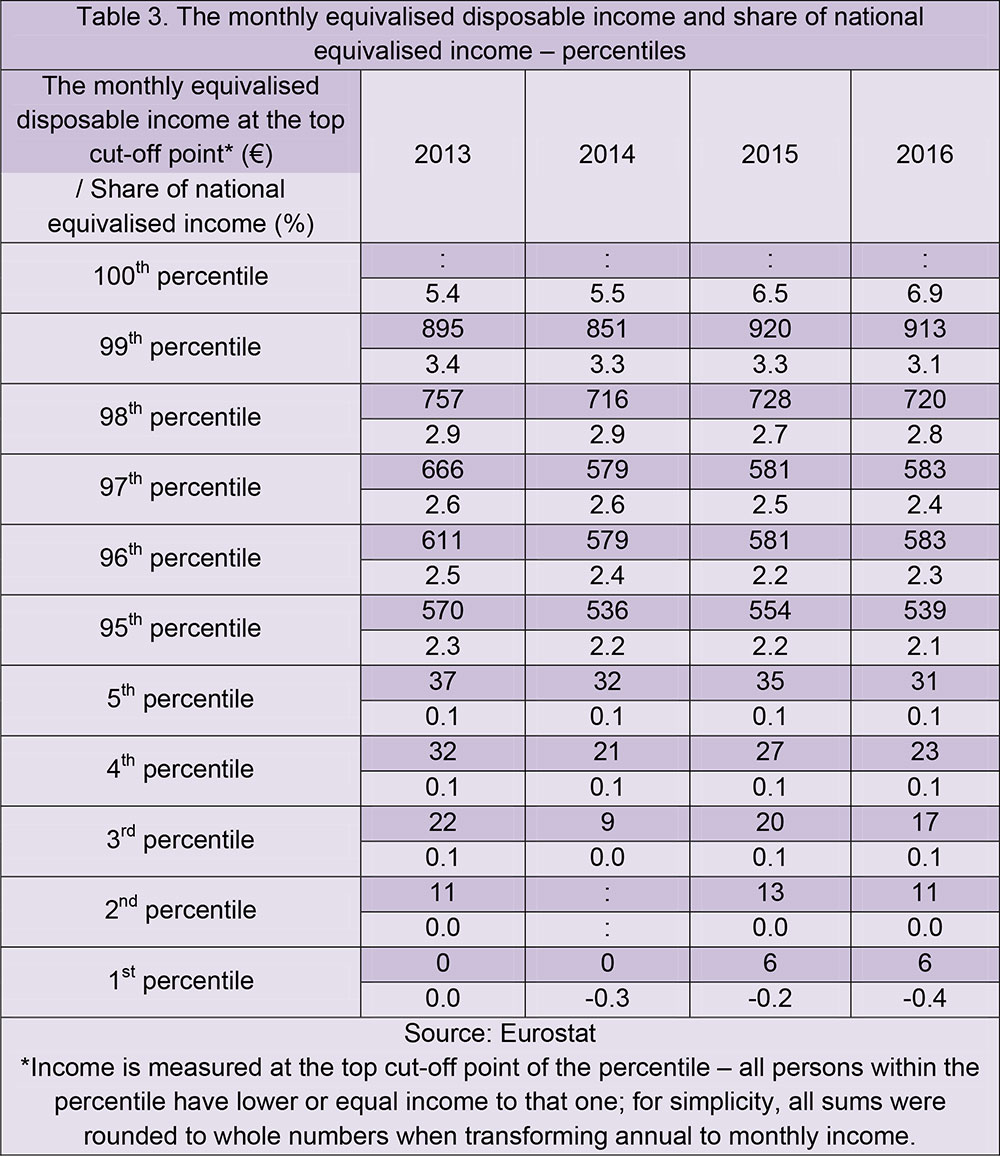
If we look at the share in the total income, we see that during the past four years of crisis and “austerity measures” we witnessed a redistribution of income from the poorest towards the richest. The poorest citizens (the first decile) have suffered a significant decline – their share has dropped from 1.4 percent to 0.9 percent. The only share that has increased significantly is that of the top 1 percent (hundredth percentile) – from 5.4 to 6.9. The gap between the hundredth percentile and the percentiles directly below it has also increased significantly.
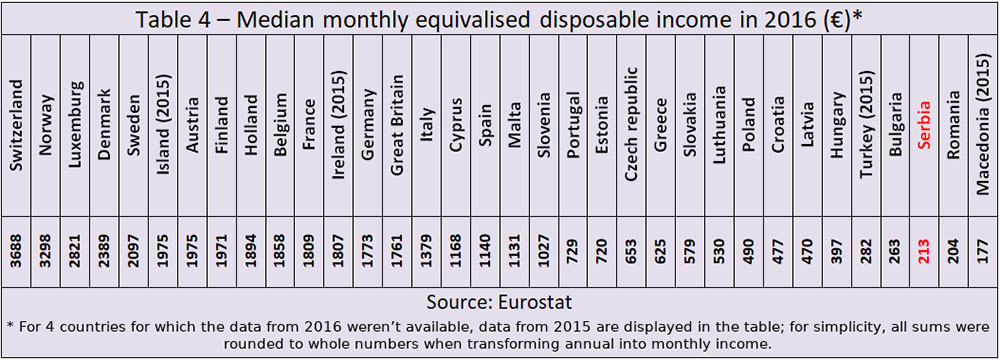
Compared to the European countries, counting those participating in EU-SILC survey whose data is presented on Eurostat website, with a median income of around €213, we are at the very bottom. Only Romania (€204) and Macedonia (€177) have lower median income. And right above Serbia are Bulgaria (€263), Hungary (€397), Lithuania (€470), Croatia (€477), etc. Those in significantly better situation include Slovenia (€1,027), Germany (€1,733) and Switzerland (€3,688).
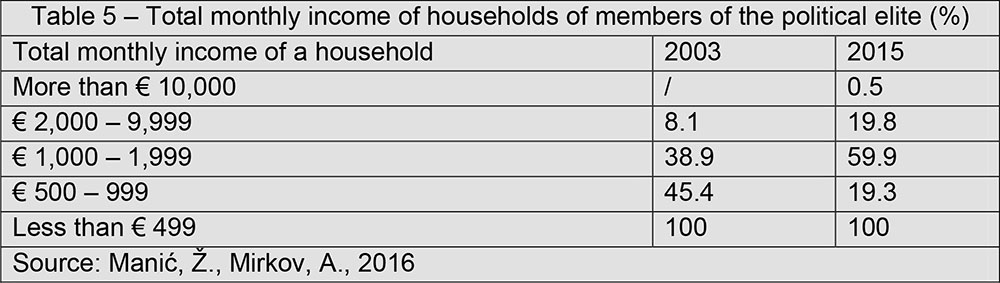
Comparing the income of the political elite in Serbia with the income of the rest of the population is interesting. We should keep in mind that the Institute for sociological research defines political elite through representation in the Parliament, meaning that the MPs from the national and provincial parliaments were surveyed. Unlike the previous tables, here the data on income is given per household. It is evident that, as the process of restoration of capitalism is progressing, the political elite is moving towards the top “one percent”, or the hundredth percentile, when it comes to income. It is clear that more than four fifths of the political elite belong to the top 10 percent of the population with the highest income. Bearing in mind that very often doubts are expressed about the credibility of the reported income of the political elite, any sociological research of the material status of this elite can only underestimate their real income.
Today, Serbia overwhelmingly resembles the society described by Marx over a century and a half ago – deeply divided between exploiters and those fighting for mere biological reproduction.
Literature
Bradaš, S. 2017. Statistics and Decent Work. Belgrade: Center for Democracy Foundation
Förster, M., M. Mira d’Ercole 2005. “Income Distribution and Poverty in OECD Countries in the Second Half of the 1990s”, OECD Social, Employment and Migration Working Papers, No. 22. Paris: OECD Publishing
Manić, Ž., Mirkov, A. 2016. “Materijalni položaj političke elite”, u Lazić, M. prir. Politička elita u Srbiji u periodu konsolidacije kapitalističkog poretka. Beograd: ISI, Čigoja štampa
The author is a sociologist from Belgrade and member of the collective Social center October.
Translated by Marijana Simic
Peščanik.net, 29.01.2018.


________________
- See Bradaš 2017:9.
- Arithmetic mean is the same if we have a group of five persons with RSD 50,000 salaries each and another group of the same size with two persons with RSD 10,000 salaries, two with RSD 15,000 and one person with RSD 200,000 salary. In both cases, average salary expressed through arithmetic mean is RSD 50,000.
- According to OECD data for 2015.
- In a surveys undertaken in 1999, the USA was one of the top OECD countries by the amount of income inequality, but its population perceived these inequalities as “too large” in the lowest percentage compared to other contries. Also, the smallest portion of the population supported measures to reduce inequalities. See Förster, M., M. Mira d’Ercole 2005:11-12.
- The tables show income per “equivalent adult”:
“All monetary incomes received from any source by each member of a household are added up; these include income from work, investment and social benefits, plus any other household income; taxes and social contributions that have been paid, are deducted from this sum; in order to reflect differences in a household’s size and composition, the total (net) household income is divided by the number of ‘equivalent adults’, using a standard (equivalence) scale: the modified OECD scale; this scale gives a weight to all members of the household (and then adds these up to arrive at the equivalised household size) 1.0 to the first adult; 0.5 to the second and each subsequent person aged 14 and over; 0.3 to each child aged under 14.”
See Glossary: Equivalised disposable income - Due to the large number of tables in the article, I decided to opt out the table with data on quartile income, i.e. population divided in four parts in an arranged series, but these data can be found on the Eurostat website.
- In this case, a decile is a tenth share of the population arranged by income from those with the lowest to those with the highest income.
- For comparison, this borderline income at the very top, between the 99th and 100th percentiles of the population, is still €500 lower than the minimum wage in France, Germany, Belgium and Holland, and only about €100 higher than the minimum wage in Slovenia or Spain.
- It’s interesting how this fits into the subjective feelings of poverty reported by members of households which participated in the survey. When they were asked whether they were able to “make ends meet”, the members of 95.6 percent of the households said “with great difficulties”, “with difficulties”, or “with certain difficulties”, while members of only 4.3 percent of the households said “somewhat easily”, “easily”, or “very easily”.
